Computing Planck Constant from LEDs
In physics, we often deal with constants that seem abstract or derived from complex, high-energy particle physics experiments. But some of these fundamental constants are surprisingly accessible. The Planck Constant (h) is one of them.
This experiment aims to measure this fundamental value using nothing more than a few LEDs, a breadboard, and a precise power analyzer. The core idea is to find the voltage where the LED current exponentially increases.
The Physics: Equating Two Energies
To understand how a simple LED can reveal a quantum constant, we need to look at two different definitions of energy: electrical and electromagnetic.
1. Electrical Energy
Electrically, an LED is a diode. To make current flow, we must apply a forward voltage. The energy an electron loses crossing this potential difference is given by:
Where:
- q is the elementary charge of an electron (1.602 × 10⁻¹⁹ C).
- V is the activation voltage (the drop across the LED).
2. Electromagnetic Energy
Quantum mechanically, when that electron crosses the band gap and recombines with a hole, it releases a photon. The energy of that photon is directly proportional to its frequency, as described by the Planck-Einstein relation:
Where:
- h is the Planck Constant (the value we want to find).
- f is the frequency of the emitted light.
The Connection
By conservation of energy, the electrical potential energy lost by the electron roughly equals the energy of the emitted photon (assuming the voltage V is exactly the band-gap energy). Therefore:
Rearranging to solve for the Planck Constant:
This equation is our roadmap. If we know the frequency (f) of the light an LED emits and we can precisely measure the voltage (V) at which it starts emitting that light, we can compute h.
The challenge, therefore, becomes an engineering one: how to precisely determine that activation voltage.
Measuring the Activation Voltage
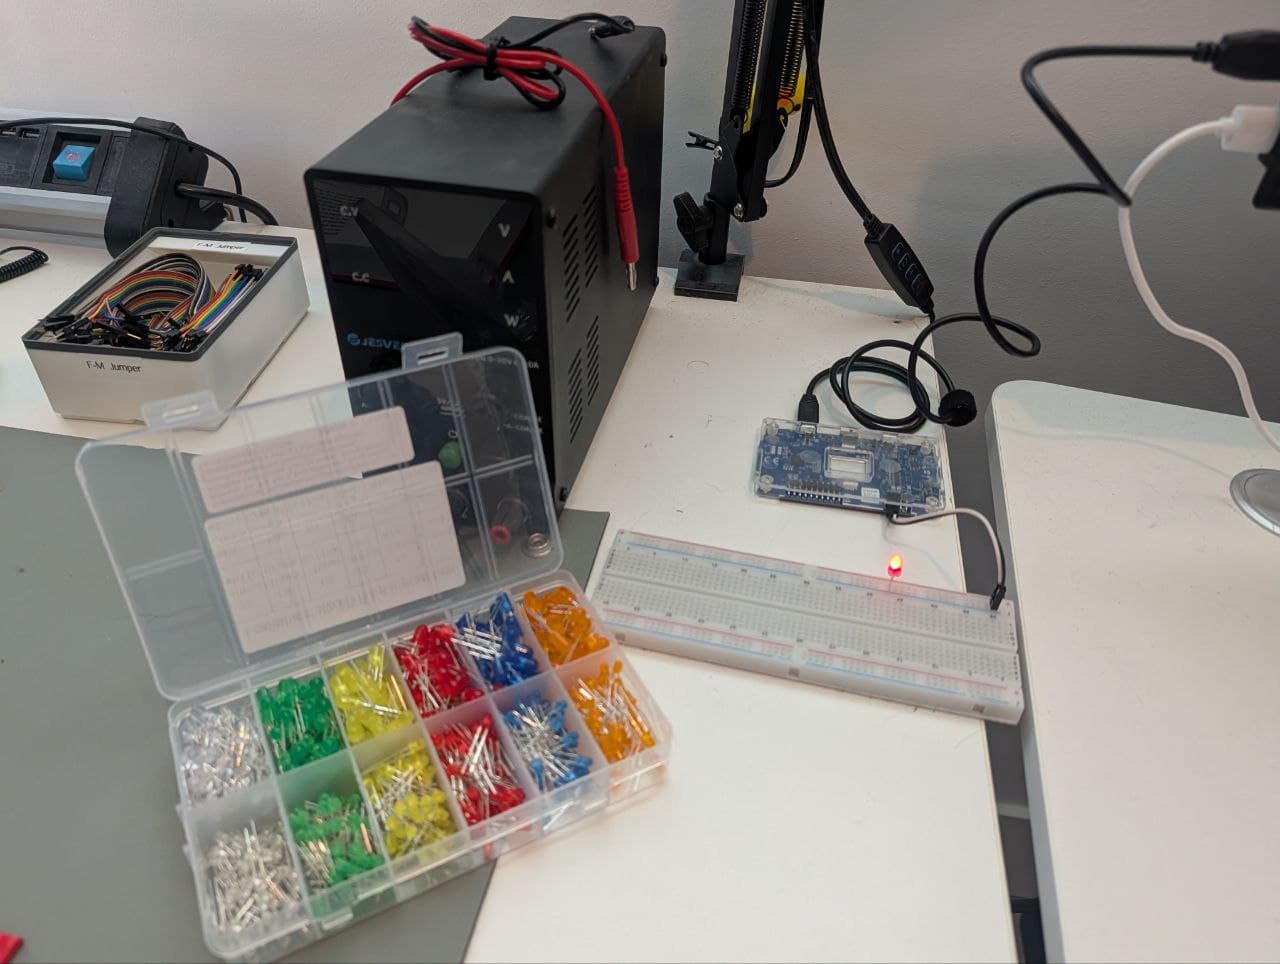
To measure these activation voltages precisely, I used a Nordic Power Profiler Kit II (PPK2). This device can act as a source meter, allowing me to set a voltage and measure the current flowing through the circuit with high accuracy.
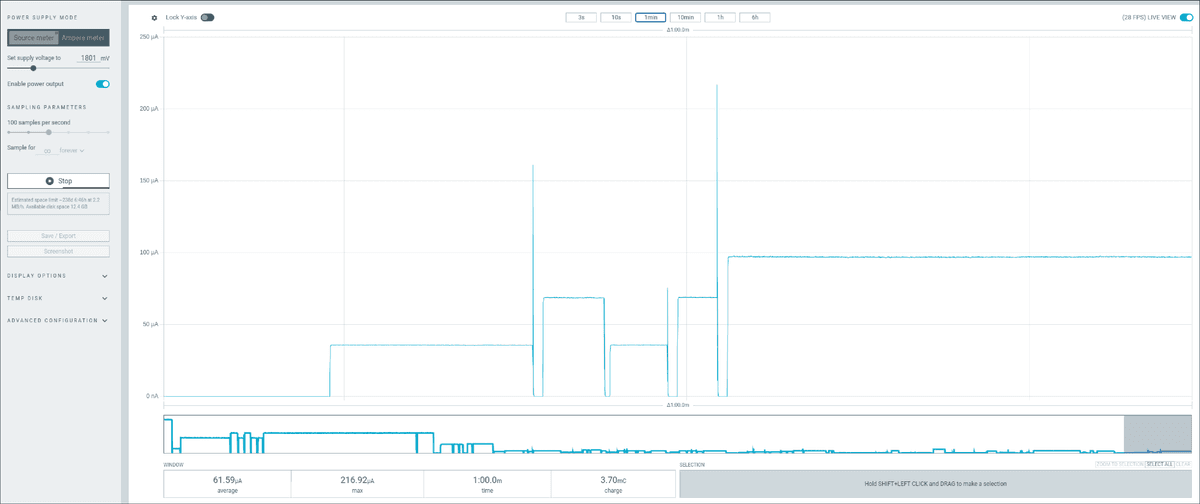
The Nordic Power Profiler Kit II application allows for precise voltage control and current measurement.
I connected each LED (Red, Orange, Yellow, Green, Blue) to the PPK2 and stepped the voltage from 1V upwards in 0.1V increments. At each step, I recorded the current consumption. This process generated the I-V (current-voltage) curves for each color.
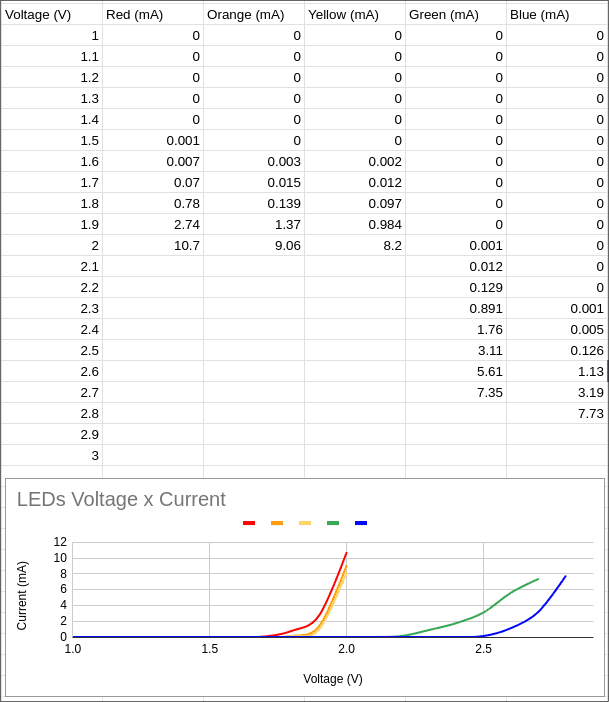
Measured current consumption table and plotted I-V curves. Note how the activation voltage increases as the wavelength decreases (Red to Blue).
The plot clearly shows that LEDs with longer wavelengths (like red) have a lower activation voltage. As we move towards shorter wavelengths (like blue), the voltage required to push current through the diode increases.
Calculating Planck Constant
With the raw data in hand, the next step was to determine exactly which voltage to use as V in our equation h = qV/f. This isn't as straightforward as it sounds because real-world diodes don't have a perfect "on" switch; they have an exponential I-V curve.
I tested three different definitions for "activation voltage" to see which one yielded the most accurate result:
- First Photons: The voltage where the LED just barely started to emit light visible to the naked eye. This proved to be too subjective and inconsistent.
- Well lit: "Eyeballing" the voltage where the brightness seemed to increase exponentially. This was better but still relied on human perception.
- 0.1 mA: Using the power profiler to find the exact voltage where the current hit 0.1 mA. This provided a consistent, quantitative threshold for the "knee" of the curve.
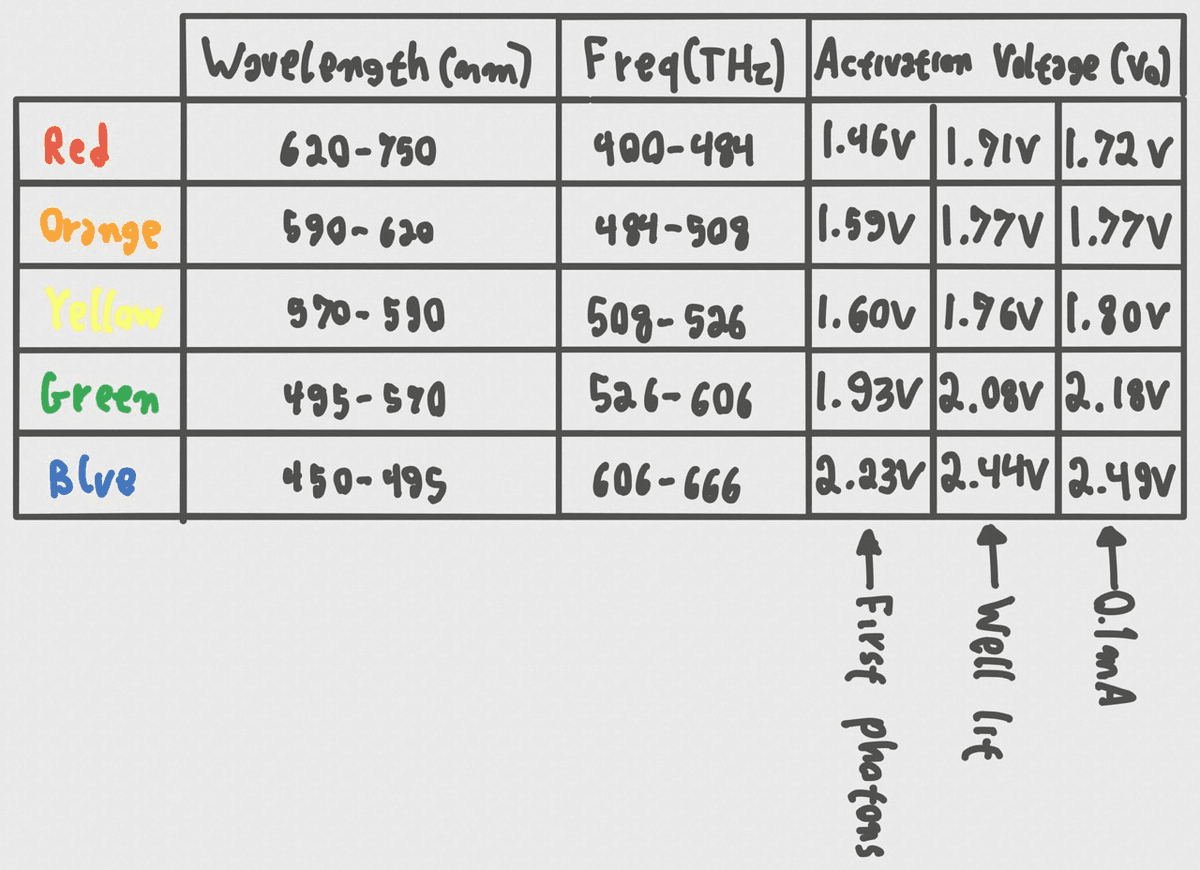
Final results table. The "0.1mA" column proved to be the most reliable approximation for the activation voltage.
Final Calculation
I focused on the Red, Green, and Blue LEDs for the final calculation, as the voltage activation gap between Yellow and Orange was too narrow to provide distinct data points.
For each of these three colors, I calculated the range for the Planck Constant. Since LEDs emit a spectrum of light rather than a single perfect frequency, I computed the minimum and maximum possible values for h based on the expected frequency range for each color.
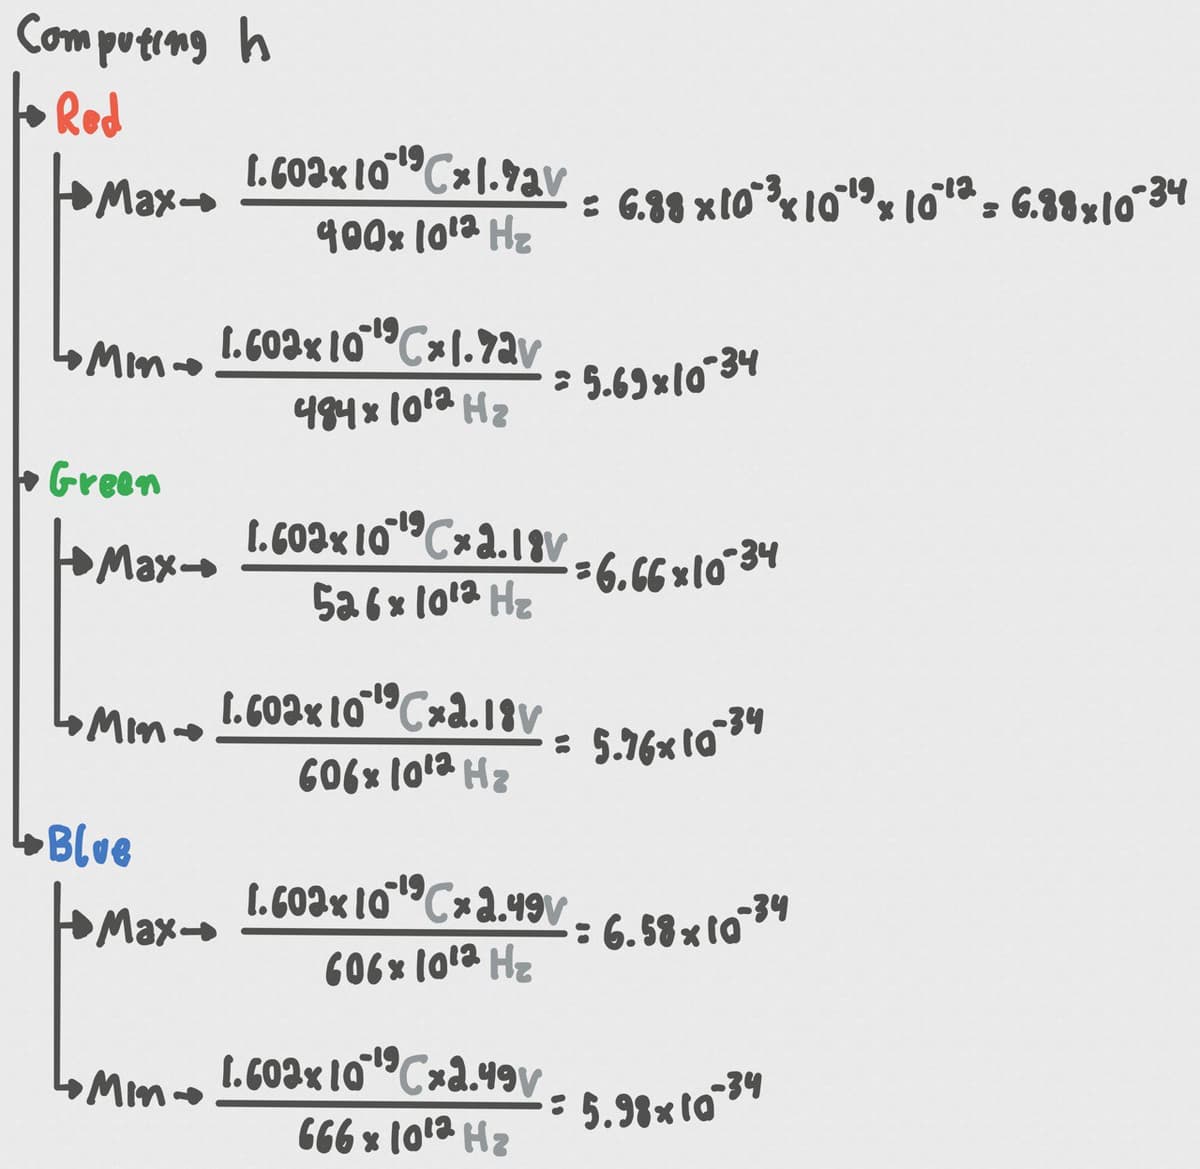
Computed Planck Constant values. The results are surprisingly close to the accepted value.
The results were surprisingly accurate. Despite the simplicity of the setup—a breadboard, some generic LEDs, and a power profiler—the calculated values hovered remarkably close to the actual Planck Constant (6.626 × 10⁻³⁴ J·s). Fun!!